
🛍️ E-commerce Analysis with BigQuery and Power BI
This project performs a complete business analytics process using Google BigQuery and Microsoft Power BI on the public dataset thelook_ecommerce.
The goal is to uncover data-driven insights about revenue trends, product profitability, and customer retention to support strategic business decisions.
🧠 Analytical Insights
Over 50% profit margin indicates operational efficiency.
Top 10 customers account for a significant share of revenue concentration.
Customer base shows declining retention post-2023, suggesting the need for re-engagement campaigns.
High-value segments (Champions & Loyal Customers) primarily located in North America and Europe.
📄 A detailed business insights PDF is being prepared and will be added soon.
🎯 Business Objective
To identify:
Which product categories and customers drive the highest revenue and profit.
How customer loyalty and retention evolve over time.
What marketing and pricing opportunities exist based on customer purchasing behavior.
📊 Dashboards Overview
🧭 1. Sales Overview Dashboard
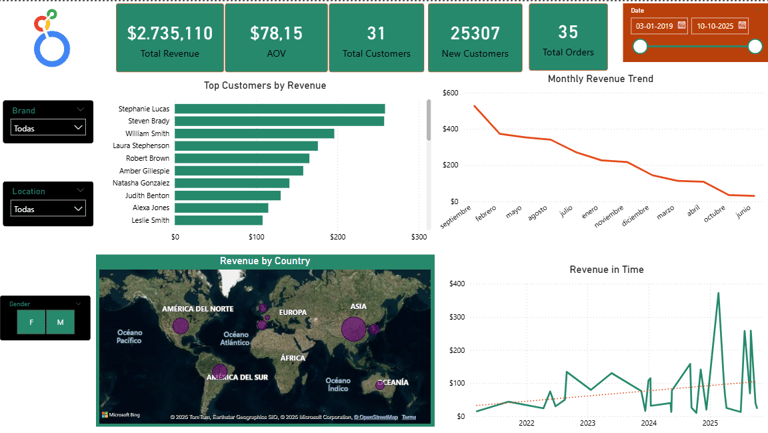
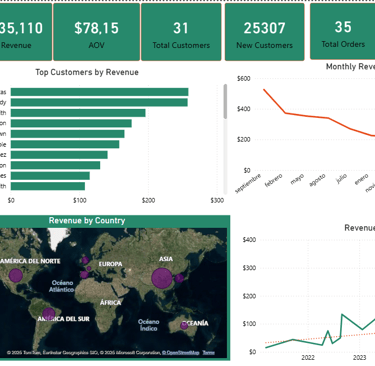
Key Metrics:
Total Revenue: $2.73M
Average Order Value (AOV): $78.15
25,307 New Customers
Monthly Revenue Trend and Top Customers
Revenue by Country & Gender filters
💰 2. Product Profitability Dashboard
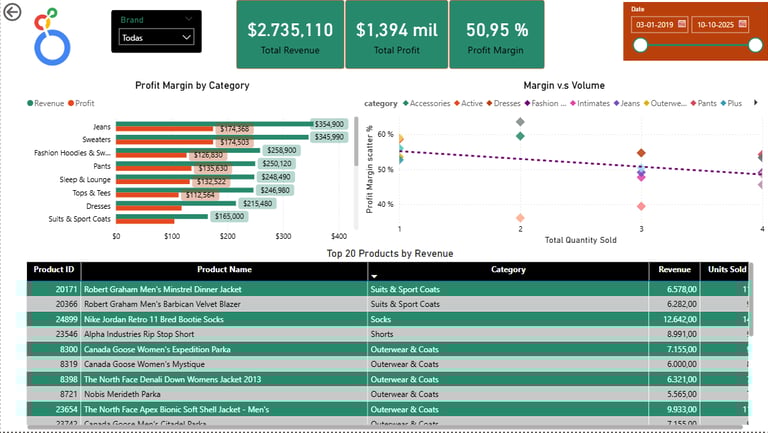
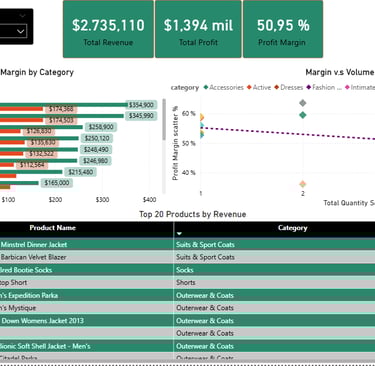
Highlights:
Total Profit: $1.39M
Profit Margin: 50.9%
Top 20 products by revenue and margin
Profit margin vs. volume correlation by category
Strategic insight: Sweaters and Jeans dominate sales volume, but Suits & Coats drive higher profitability.
👥 3. Customer Retention & RFM Dashboard
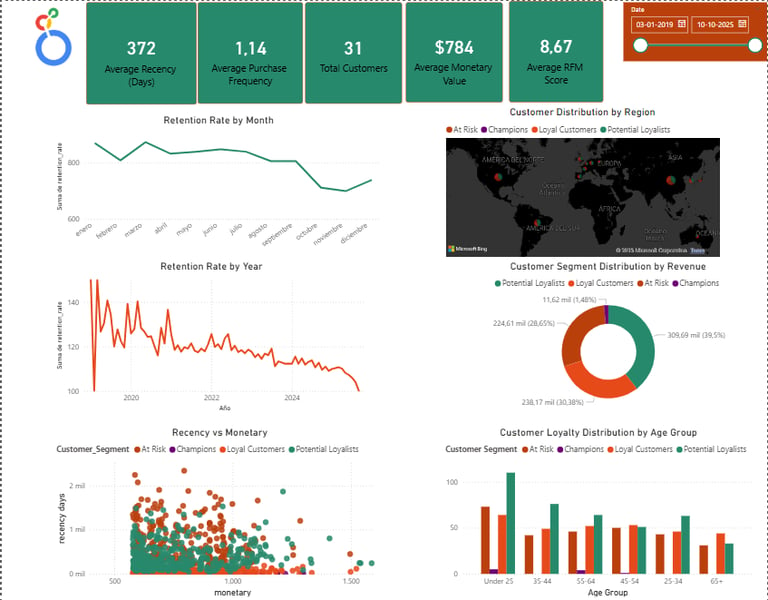
Average Recency: 372 days
Average Frequency: 1.14
Average Monetary Value: $784
Average RFM Score: 8.67
Distribution by region, segment, and age group
Retention rate trends (monthly and yearly)
Segmentation Logic (RFM):
Champions: High frequency, high monetary value, recent purchases
Loyal Customers: Frequent buyers with consistent monetary value
Potential Loyalists: Newer customers with medium frequency
At Risk: Long recency and low frequency
⚙️ Technical Process
Data Exploration (BigQuery)
Cleaned and joined transactional tables (orders, products, customers, inventory_items)
Created derived tables for sales, margin, and customer cohorts.
ETL Logic
Aggregated by order_id, product_id, and customer_id
Created sales_base and rfm_table views for Power BI connection.
Power BI Modeling
Star schema with fact tables (Sales, RFM) and dimension tables (Products, Customers, Calendar)
Relationships defined with single-direction filters to ensure measure accuracy. -
💡 Skills Demonstrated
Advanced SQL (CTEs, aggregations, window functions).
Power BI Data Modeling & DAX.
KPI Design and Dashboard Storytelling.
Business Analysis and Data Interpretation.
Git-based Project Documentation.